
When working with large volumes of data, there can be so much information that trying to make sense of a table or panel can become too complex, or simply a chore. In our data analytics projects in the Sisense platform, a frequent issue is the need to build visual dashboards that can guide users in their analysis and streamline the process as a whole.
Simple resources, such as using colors and different font weights, can improve user experience with dashboards, whether they are part of the BI team or the C-suite. This post teaches you a quick and simple way to use JavaScript to make your dashboards and indicators more visual.
When you create an indicator from scratch, it probably looks something like this:
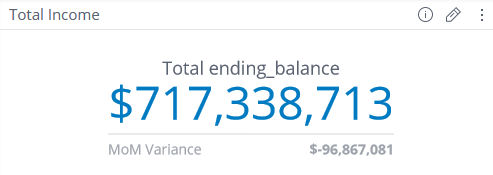
The first thing we can do, before getting into JavaScript code, is disable the title. Usually, the Indicator title is enough. Since that’s the case here, that’s where we’ll start.
It’s pretty simple setting change:
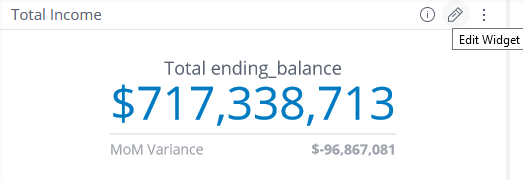
- Click on Edit widget:
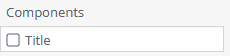
- Go to the Design tab on the right side of the screen, choose Components, and disable Title:
- This is what the indicator looks like without the title:

Now here’s a secret weapon to improve the way your indicators are displayed. You can use the JavaScript code below to add a small arrow indicating whether a given value went up or down, and also set its color based on the meaning of that change:

The script should be added at the widget level. To do this, open the widget in editing mode, click on the kebab menu, then click on the Edit Script option:
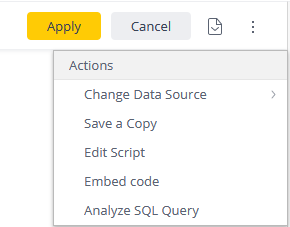
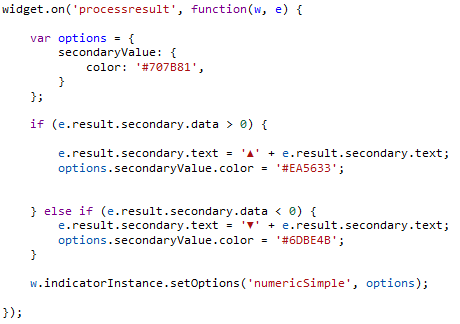
The widget script opens up, and you can simply paste the code there:
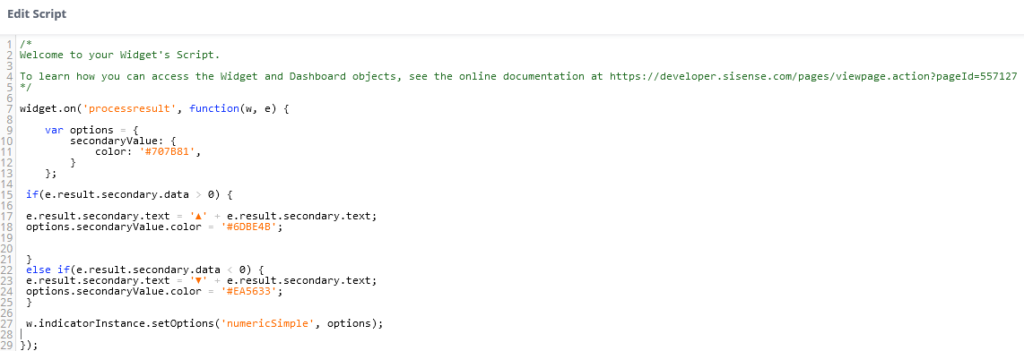
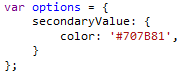
Let’s look at this code step by step. We use the processresult event, fired when executing the widget’s native result processing. Before rendering is the perfect moment for customization. We can set the default color in the options structure—here, a shade of gray for when the value is equal to 0 and we don’t want to highlight it.
Next, a simple if/else if statement analyzes whether the value is greater than 0. If so, it adds the up arrow and sets the color to green. If it’s lower than zero, it inserts the down arrow and sets it to red.
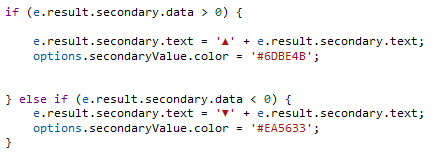
The last row sets the options defined in the object.

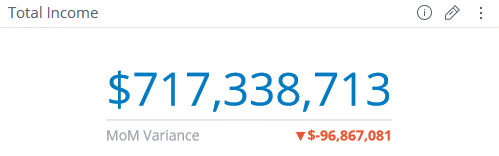
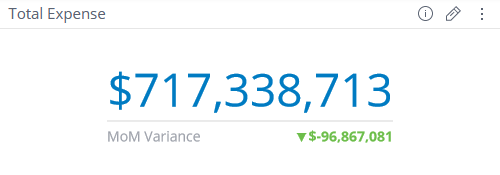
Now our indicator looks much better:
One important part of this process is analyzing if the increase or decrease is a good sign or a bad sign. Here’s a quick example:
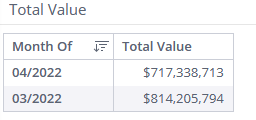
In this pivot table, we can see the difference between April and March. If Total Value represents an Income, for example, we see the same behavior as the indicator analyzed above. Since income decreased in April, the color is set to red.
But if Total Value is actually an Expense, the color should be set to green:
This small change can be written into the code by switching the hex value in the if/else if statements:
That’s it! Now we can clearly see the difference between an unchanged indicator and the one we built:
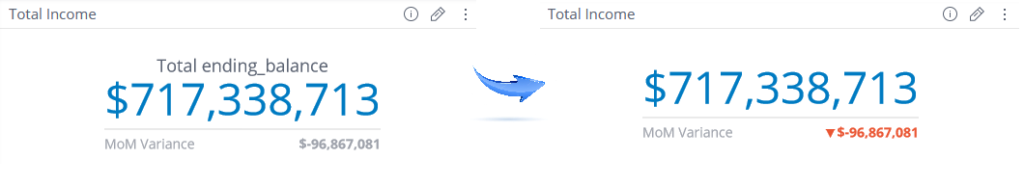
This is a straightforward example of how to highlight a previously opaque piece of information, something that didn’t stand out on your dashboard. After following the steps above, the user can see right away how the indicator is performing.
Want more tips like that? Then subscribe to our blog and follow BlueMetrics on social media. And if you’re interested in our help with your data analytics projects in the Sisense platform, let’s schedule a meeting! Just fill out the form and we’ll be in touch.